
As a small business owner, you’ve got a “number” in mind. It may be new clients, annual revenue, or the amount you need in the bank to sleep easy. But in the daily grind of client work and projects, it’s easy to lose track of how you’re really doing. An Intuit survey found that 30% of small businesses struggle to track cash flow, leaving owners stressed and second-guessing their finances.
Sound familiar? You’re not alone. Financial reports aren’t just for accountants—they’re your business dashboard, providing clear insights to keep you on track. Think of them like the gauges on your car’s dashboard: you don’t need to be a mechanic to read the speedometer or check the fuel level. Here are the six reports that make up your business dashboard.
Table of Contents
- Profit and Loss (P&L) Statement or Income Statement
- Balance Sheet
- Cash Flow Statement
- Accounts Receivable (A/R) Aging Report
- Sales by Customer (or Client) Summary
- Expenses by Vendor (or Category) Report
- TL;DR: The 6 Reports at a Glance
- From Information to Action
Profit and Loss (P&L) Statement or Income Statement
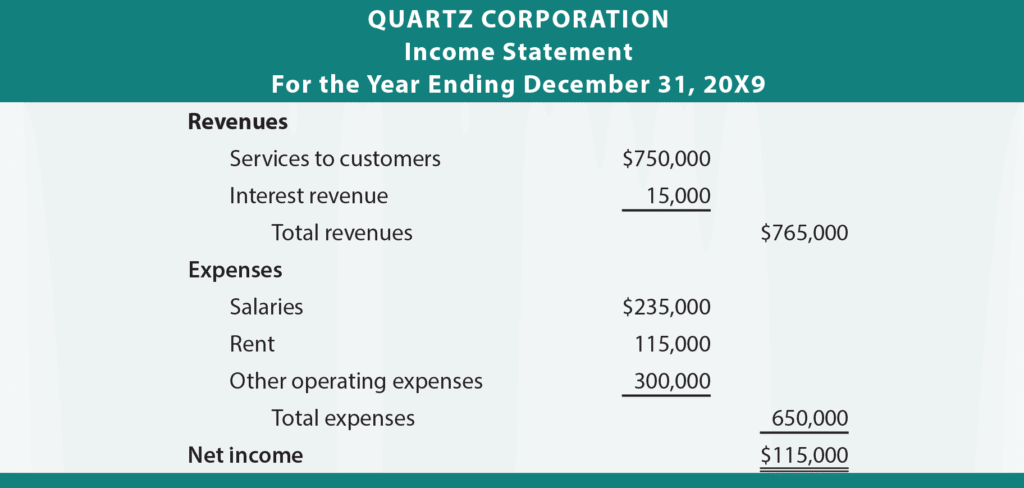
Example of Income Statement (Source: principlesofaccounting.com)
This is your business’s report card. In the simplest terms, it tells you if you made or lost money over a set period, like a month, a quarter, or a year.
- What’s in It?
- Revenue (Income): All the money you earned from selling your services or products.
- Expenses: All the money you spent to run the business.
- Net Income (The Bottom Line): What’s left when you subtract expenses from income.
For years, I just watched my bank balance. If it went up, I figured it was a good month. But the P&L showed me the truth. I once discovered I was spending nearly 20% of my revenue on various software trials and subscriptions I’d forgotten about. Seeing it in black and white was the wake-up call I needed.
Balance Sheet
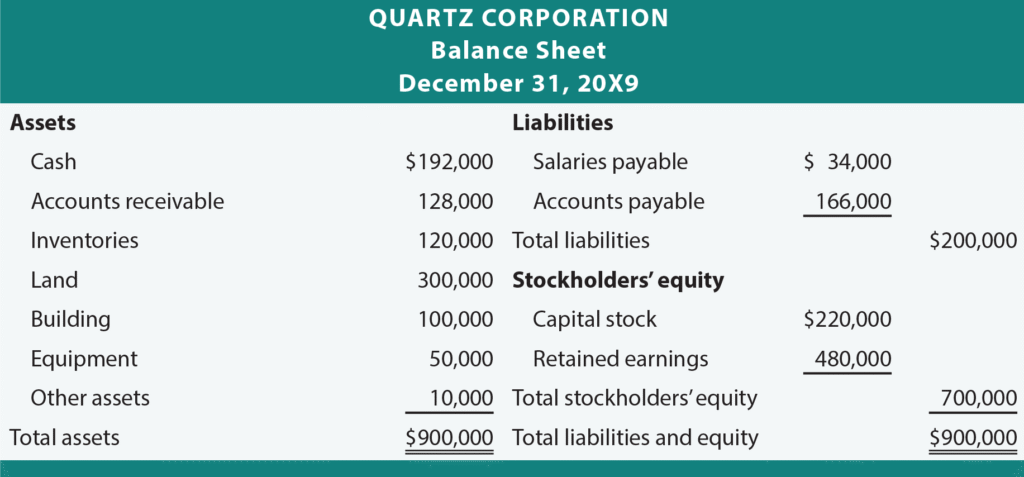
Example of Balance Sheet (Source: principlesofaccounting.com)
Think of this as a snapshot of your business’s financial health on one specific day. It shows what your business is worth at that moment.
- What’s in It?
- Assets: Everything your business owns that has value, like cash, equipment, and money owed to you.
- Liabilities: Everything your business owes to others, such as loans or credit card debt.
- Equity: What’s left for you, the owner, i.e. Assets minus Liabilities.
This report is crucial for seeing your stability. However, because it’s a snapshot on a single day, it can’t show you the flow of money. It tells you that you have $10,000 in the bank today, but not how it got there or where it went last week. For that, you need the next report.
Cash Flow Statement
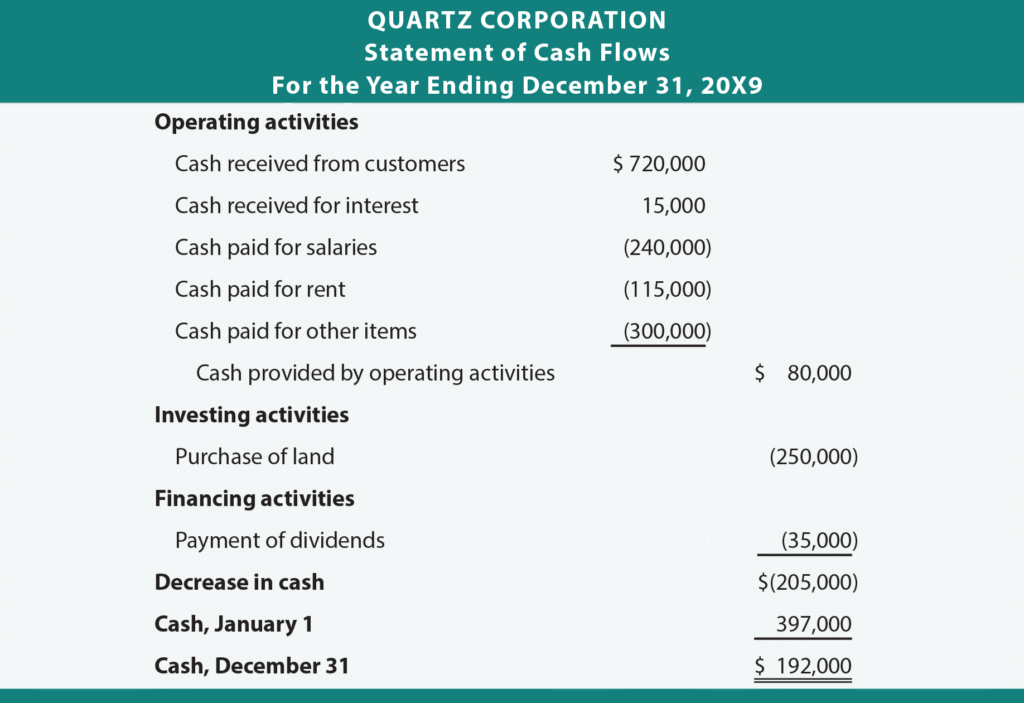
Example of Cash Flow (Source: principlesofaccounting.com)
This is the story of the cash moving through your business. While the P&L can be misleading (it includes sales you haven’t collected cash for yet), this report tracks the actual hard cash that has come in and gone out.
- What’s in It? It tracks the journey of your cash from three sources:
- Operating: Cash from your main day-to-day business.
- Investing: Cash used to buy or sell big assets like a computer.
- Financing: Cash from loans or your own pocket.
A frequently-quoted study by Jessie Hagen found that 82% of business failures are due to poor cash flow. This report is your early warning system. While the Balance Sheet shows a snapshot of your cash at one moment, the Cash Flow Statement is like a video, showing you exactly when money came in and when it went out over a period. This helps you spot dangerous trends, like if you’re consistently spending cash faster than you’re collecting it.
Accounts Receivable (A/R) Aging Report
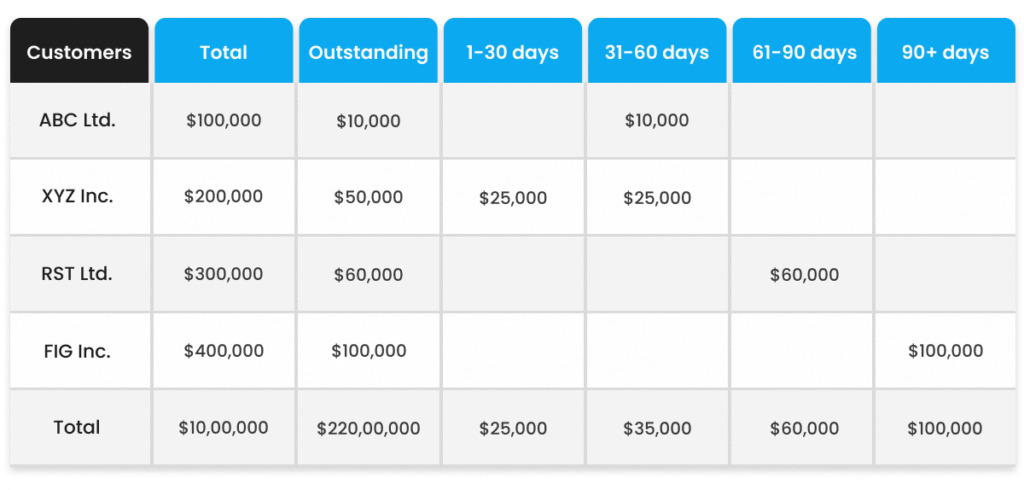
Example of A/R Aging Report (Source: highradius.com)
This is your “who owes me money?” list. It’s a simple but powerful report that gives you a detailed breakdown of all your unpaid invoices.
- What’s in It? A list of every unpaid invoice, neatly sorted by how long it has been overdue (e.g., 0-30 days, 31-60 days, 61-90+ days).
This report is your action plan for getting paid. A Melio survey shows more than half of small businesses experience late payments by large companies, and while most operate on net 30 terms, 25% report waiting 20–30 days past the due date. Instead of a vague feeling that “some clients are late,” this report tells you exactly who to call first.
Sales by Customer (or Client) Summary
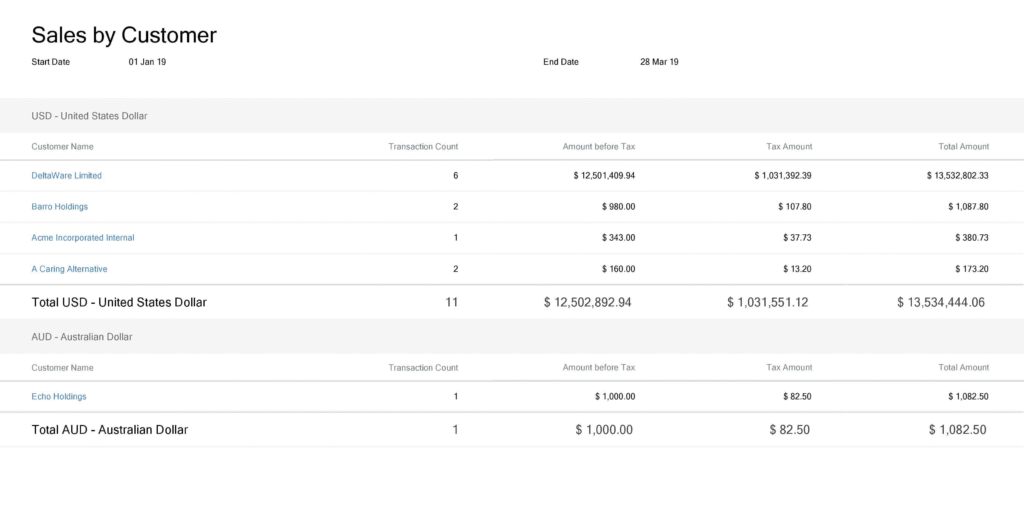
Example of Sales by Customer Summary (Source: avaza.com)
This report can be a real eye-opener. It shows you exactly which clients are generating the most money for your business.
- What’s in It? A list of your clients, ranked from highest to lowest by how much you’ve invoiced them over a set period.
I used to think my “biggest” client was the one who made the most noise and took up the most time. After running this report, I realized my most valuable client was actually a quiet, low-maintenance account that paid on time, every time. This insight is gold. It helps you understand who to focus on.
Expenses by Vendor (or Category) Report
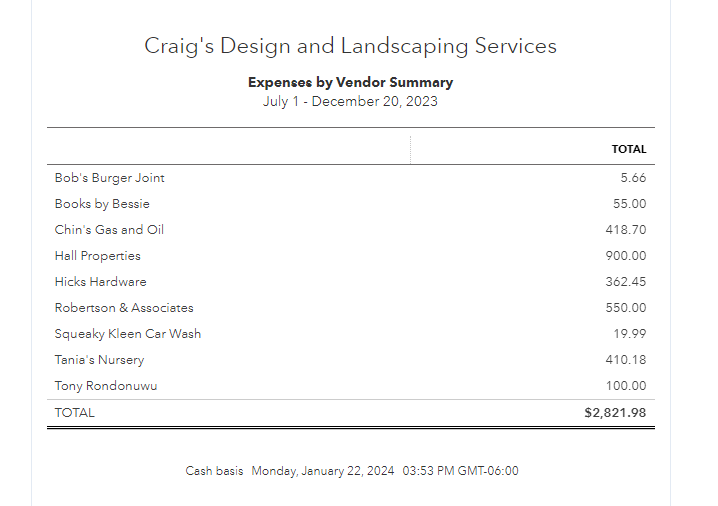
Example of Sales by Customer Summary (Source: accurabooks.com)
Just as you track where money comes from, it’s critical to see where it’s going. This report breaks down your spending so you can see every detail.
- What’s in It? A list of your expenses, grouped by category (like “Software” or “Marketing”) or by who you paid.
Why it matters: This report helps you find “cost leaks.” You might discover that your shipping costs have quietly doubled or that you’re spending far more on one software tool than you realized. Seeing it laid out so clearly makes it easy to spot chances to save.
TL;DR: The 6 Reports at a Glance
- Profit & Loss: Tells you if you’re making a profit.
- Balance Sheet: Shows your financial health on a single day.
- Cash Flow Statement: Tracks the story of cash moving in and out of your bank.
- A/R Aging: Shows you exactly who is late on their payments.
- Sales by Customer: Reveals who your most valuable clients really are.
- Expenses by Vendor: Pinpoints where your money is actually going.
From Information to Action
Running these reports isn’t about creating more paperwork. It’s about trading anxiety for clarity. Start by picking just one or two of these to look at each month. Get familiar with the story they tell.
When you understand your numbers, you stop guessing and start making strategic decisions. You gain the confidence that comes from truly knowing your business, inside and out.
Ready for True Financial Clarity?
Feeling more confident about these reports is a great first step. The next is putting them to work without losing hours of your time. At Fynlo, our software makes running these reports simple, and our team of experienced accountants can help you understand the story behind the numbers. Stop guessing and start knowing, schedule a free call with us today.