
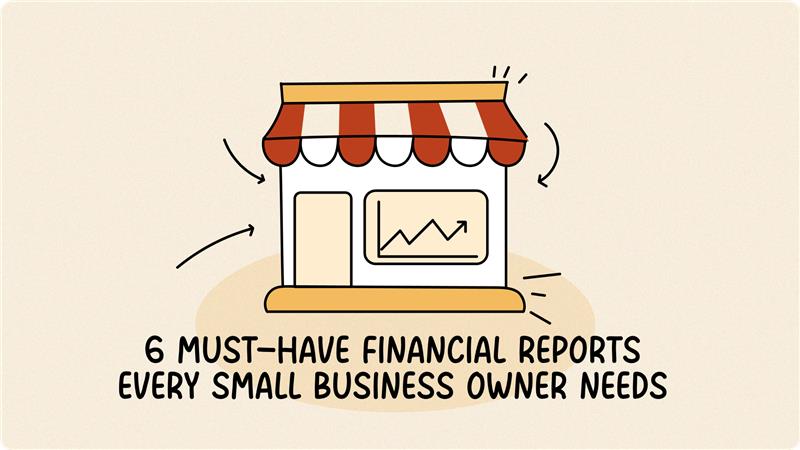
6 Must-Have Financial Reports Every Small Business Owner Needs
As a small business owner, you’ve got a “number” in mind. It may be new clients, annual revenue, or the amount you need in the bank to sleep easy. But in the daily grind of client work and projects, it’s easy to lose track of how you’re really doing. An Intuit survey found that 30% of small businesses struggle to track cash flow, leaving owners stressed and second-guessing their finances. Sound familiar? You’re not alone. Financial reports aren’t just for accountants—they’re your business dashboard, providing clear insights to keep you on track. Think of them like the gauges on your car’s dashboard: you don’t need to be a mechanic to read the speedometer or check the fuel level. Here are the six reports that make up your business dashboard. Table of Contents Profit and Loss (P&L) Statement or Income Statement Example of Income Statement (Source: principlesofaccounting.com) This is your business’s report card. In the simplest terms, it tells you if you made or lost money over a set period, like a month, a quarter, or a year. For years, I just watched my bank balance. If it went up, I figured it was a good month. But the P&L showed me the truth. I once discovered I was spending nearly 20% of my revenue on various software trials and subscriptions I’d forgotten about. Seeing it in black and white was the wake-up call I needed. Balance Sheet Example of Balance Sheet (Source: principlesofaccounting.com) Think of this as a snapshot of your business’s financial health on one specific day. It shows what your business is worth at that moment. This report is crucial for seeing your stability. However, because it’s a snapshot on a single day, it can’t show you the flow of money. It tells you that you have $10,000 in the bank today, but not how it got there or where it went last week. For that, you need the next report. Cash Flow Statement Example of Cash Flow (Source: principlesofaccounting.com) This is the story of the cash moving through your business. While the P&L can be misleading (it includes sales you haven’t collected cash for yet), this report tracks the actual hard cash that has come in and gone out. A frequently-quoted study by Jessie Hagen found that 82% of business failures are due to poor cash flow. This report is your early warning system. While the Balance Sheet shows a snapshot of your cash at one moment, the Cash Flow Statement is like a video, showing you exactly when money came in and when it went out over a period. This helps you spot dangerous trends, like if you’re consistently spending cash faster than you’re collecting it. Accounts Receivable (A/R) Aging Report Example of A/R Aging Report (Source: highradius.com) This is your “who owes me money?” list. It’s a simple but powerful report that gives you a detailed breakdown of all your unpaid invoices. This report is your action plan for getting paid. A Melio survey shows more than half of small businesses experience late payments by large companies, and while most operate on net 30 terms, 25% report waiting 20–30 days past the due date. Instead of a vague feeling that “some clients are late,” this report tells you exactly who to call first. Sales by Customer (or Client) Summary Example of Sales by Customer Summary (Source: avaza.com) This report can be a real eye-opener. It shows you exactly which clients are generating the most money for your business. I used to think my “biggest” client was the one who made the most noise and took up the most time. After running this report, I realized my most valuable client was actually a quiet, low-maintenance account that paid on time, every time. This insight is gold. It helps you understand who to focus on. Expenses by Vendor (or Category) Report Example of Sales by Customer Summary (Source: accurabooks.com) Just as you track where money comes from, it’s critical to see where it’s going. This report breaks down your spending so you can see every detail. Why it matters: This report helps you find “cost leaks.” You might discover that your shipping costs have quietly doubled or that you’re spending far more on one software tool than you realized. Seeing it laid out so clearly makes it easy to spot chances to save. TL;DR: The 6 Reports at a Glance From Information to Action Running these reports isn’t about creating more paperwork. It’s about trading anxiety for clarity. Start by picking just one or two of these to look at each month. Get familiar with the story they tell. When you understand your numbers, you stop guessing and start making strategic decisions. You gain the confidence that comes from truly knowing your business, inside and out. Ready for True Financial Clarity? Feeling more confident about these reports is a great first step. The next is putting them to work without losing hours of your time. At Fynlo, our software makes running these reports simple, and our team of experienced accountants can help you understand the story behind the numbers. Stop guessing and start knowing, schedule a free call with us today.
Financial Statements: A Comprehensive Guide
Most of us who go out on our own do it for the work itself. Whether you’re a designer, a writer, or a consultant, you’re driven by the craft. But then you start your business, and you realize you’ve also become its reluctant Chief Financial Officer. I remember my first year, staring at my accounting software and feeling completely out of my depth. I was great at my actual job, but when it came to the money side, I was just guessing. I’d look at my bank account, see money in there, and figure I was doing okay. But I always had this low-level hum of uncertainty. Am I really making a profit? Am I charging enough? Where is all the money going? It turns out the answers to those questions are sitting in three financial reports. They sound intimidating, but they’re really just tools to help you trade that uncertainty for clarity. Table of Contents The Income Statement: Answering, “Did I Actually Make a Profit?” Example of Income Statement (Source: principlesofaccounting.com) This is the most basic question, and the Income Statement (often called the P&L for Profit & Loss) answers it directly. It’s a simple summary of your revenue versus your expenses over a specific period, like a month or a quarter. In my early days, I felt like I was working constantly but my savings weren’t growing. I finally sat down and looked at my P&L. The “aha!” moment wasn’t some huge, dramatic discovery. It was seeing I was spending nearly $150 a month on various software subscriptions I’d signed up for and forgotten about. It’s the small leaks that often sink the ship. The P&L helps you spot them. It shows you the real cost of doing business, beyond just the big, obvious expenses. The Balance Sheet: A Snapshot of Your Business’s Financial Health Example of Balance Sheet (Source: principlesofaccounting.com) Being profitable month-to-month is great, but you also want to know if you’re building a stable business over the long term. That’s where the Balance Sheet comes in. If the P&L is a movie of your recent performance, the Balance Sheet is a snapshot of your business’s financial health right now. It’s based on a simple formula: Assets (What you have) = Liabilities (What you owe) + Equity (What’s yours) Honestly, for a long time, I ignored my Balance Sheet. It felt too “corporate.” But it’s surprisingly practical. And critical, too: according to Intuit QuickBooks, 57% of small business owners have experienced problems with their cash flow. Business owners lose $34,000 on average by being forced to turn down work, specifically due to issues created by insufficient cash flow. That “Accounts Receivable” line shows you exactly how much money you’re waiting on from clients. Seeing that number get too big can be the nudge you need to get better about your payment terms and follow-ups. The Cash Flow Statement: Tracking Where Your Money Really Goes Example of Cash Flow (Source: principlesofaccounting.com) This is the big one. Have you ever had a profitable month on paper but felt completely broke? I’ve been there. You’ve done the work, you’ve sent the invoices, but your bank account is dangerously low and bills are due. This is a cash flow problem, and the Cash Flow Statement is the tool that explains it. It tracks the actual cash moving in and out of your business. According to SCORE, 82% of small businesses that fail do so because of poor cash flow. It’s not that they aren’t profitable, it’s that they run out of cash. A friend of mine who runs a small trade business almost learned this the hard way. His P&L looked fantastic because he was landing big jobs. But he was paying his suppliers in 30 days, while his clients were taking 60 or even 90 days to pay him. His business was profitable, but it was being starved of cash. The Cash Flow Statement made this timing gap impossible to ignore. It forced him to start collecting deposits upfront and tighten his payment deadlines. It didn’t just lower his stress; it saved his business. From Numbers to Know-How Look, nobody gets into freelancing because they have a passion for spreadsheets. But you owe it to yourself and your business to understand the basics. You don’t need to become an accountant, you just need to get curious. Start small. Ask your bookkeeper or use your accounting software to run your P&L once a month. Take 20 minutes to look at it. Where did your money come from? Where did it go? Doing this consistently replaces that vague financial anxiety with quiet confidence. You start making decisions based on real data, not just a gut feeling. And in this line of work, having fewer unpleasant surprises is one of the best assets you can have. Ready to trade that financial uncertainty for clarity? At Fynlo, we handle the accounting and bookkeeping so you can focus on what you do best. Let us help you understand the story your numbers are telling. Schedule a free call with us today.